Html RID

We actively
contribute to
decarbonizing
the real
economy.

Highlights

At the end of 2024, we exceeded the targets we set for ourselves when we launched our new climate strategy in 2021. Our low-carbon assets stood at $58 billion, up $40 billion since 2017 and above our target of $54 billion by 2025. The carbon intensity of our portfolio was down 69% since 2017, surpassing our target of a 60% reduction by 2030. We completed our exit from oil production and thermal coal mining by the end of 2023.

Our portfolio’s decarbonization has therefore proceeded at a faster pace than that of the real economy. This was due both to the decarbonization of our portfolio companies and to our strategy of investing in low-carbon, low-intensity and transition-promoting assets.

$58 B

in low-carbon
assets
Target exceeded

69%

decrease in our portfolio’s carbon intensity since 2017
Target exceeded

$6.2 B

in transition
assets


$358 B

in assets with a low-carbon footprint


Our low-carbon assets

Our investments in low-carbon assets target net‑zero companies or companies with very low carbon emissions. These investments have increased by $40 billion since 2017 to $58 billion as at December 31, 2024, exceeding our target of $54 billion by 2025. Our investment strategy is focused on the renewable energy, sustainable mobility and real estate sectors. We are also investing selectively in developing sectors, such as energy storage and efficiency, as well as green hydrogen.

$58 B

in low-carbon assets
at the end of 2024

Target: $54 B in 2025

Our low-carbon assets meet rigorous global standards set by the Climate Bonds Initiative (CBI) taxonomy, which we have been using since 2017.

As at December 31, 2024, the value of these assets reached $58 billion. We therefore exceeded our target of $54 billion by 2025.

Of these, a total of $15.5 billion is invested in Québec.

Chart 2
By the end of 2024, CDPQ had exceeded its target for low-carbon assets (in $B)

* New in 2024

Our assets aligned with SBTi standards

Many of our portfolio companies are committed to the climate transition. Some have set ambitious decarbonization targets and have been certified by the Science Based Targets initiative (SBTi), validating that they are aligned with the objectives of the Paris Agreement.

Our portfolio has $79 billion in SBTi-compliant assets and another $15 billion in the process of becoming compliant. When they are added to our low-carbon assets ($58 billion), we have $152 billion aligned with the Paris Agreement or in the process of becoming aligned.

As a result, we have three levels of assets involved in the fight against climate change: low-carbon assets, SBTi-compliant assets and assets in the process of becoming compliant (see Figure 3).

Figure 3
Our portfolio has three levels of assets adressing climate change
The figure shows our three levels of assets involved in the fight against climate change, with low-carbon assets ranked first, followed by SBTi-compliant assets, and assets in the process of becoming SBTi-compliant.

In 2024, we added low-carbon assets from around the world to our portfolio.

Inuyama

  • Acquisition of an 80% stake in a solar power park in Japan
  • Co-investment with our partner, Shizen Energy
  • 31 MW solar power plant, capable of supplying the equivalent of 7,850 homes

SunZia

  • 3.5 GW wind farm project in New Mexico, U.S.
  • Largest project of its kind in North America
  • 900-km transmission line to deliver electricity to markets in Arizona and California

Carbon intensity
of our portfolio

The carbon intensity of our portfolio is calculated each year using the methodology required by the NZAOA, of which we are a founding member. Our scope 3, category 15 financed emissions, as defined by the Greenhouse Gas Protocol, account for 100% of the emissions from our investments in companies, representing the vast majority of emissions from our assets.

69% decrease in the portfolio’s carbon intensity by the end of 2024 from 2017

Target: 60% by 2030

Carbon intensity

We calculate the carbon intensity of our portfolio companies taking into account only scope 1 and scope 2 emissions. Data on their scope 3 emissions is generally not available or not reliable enough to be included.

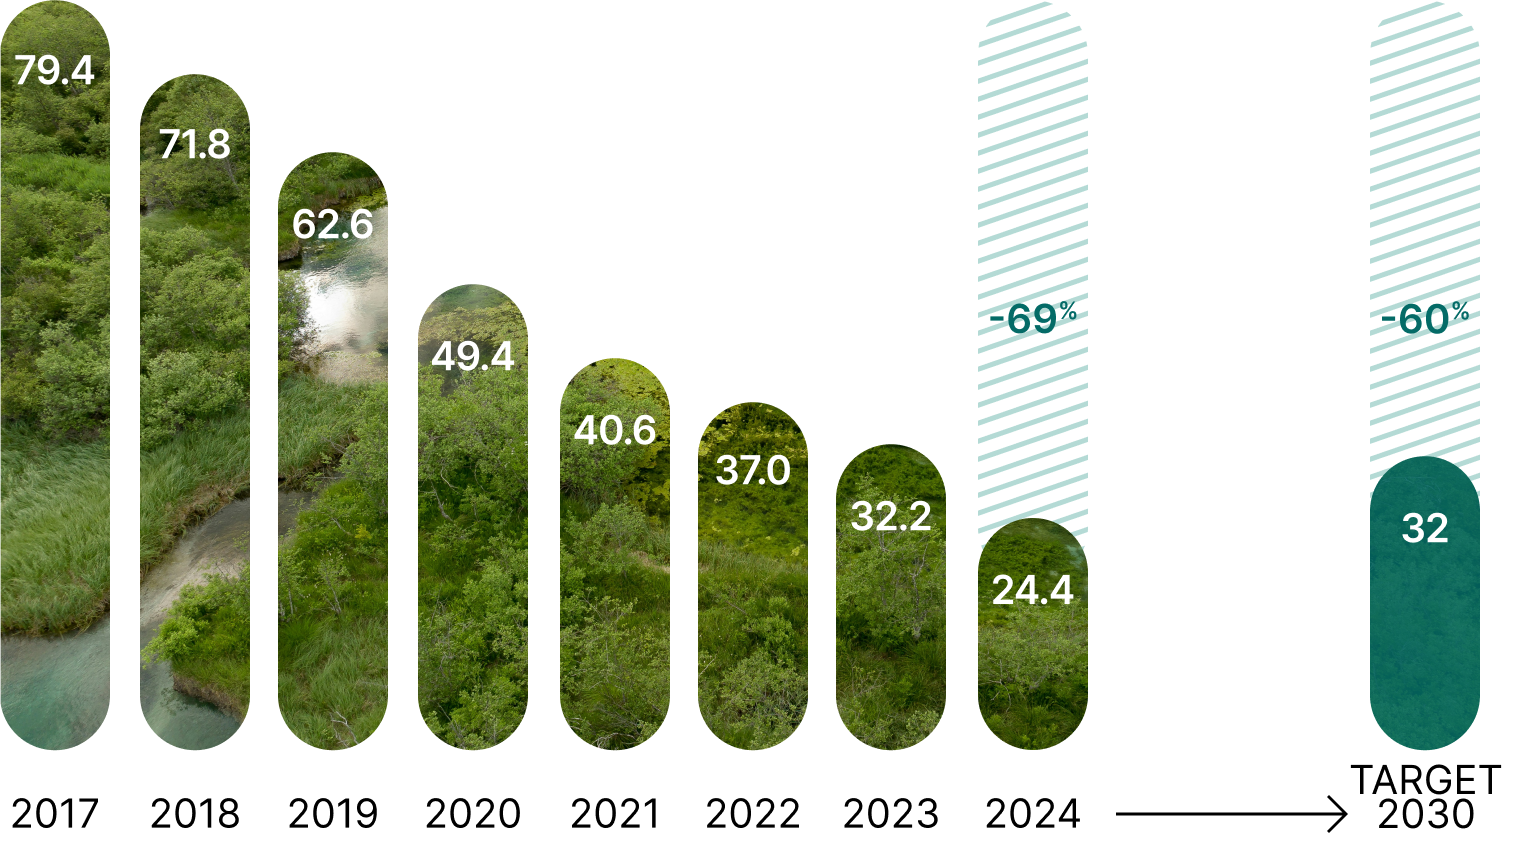
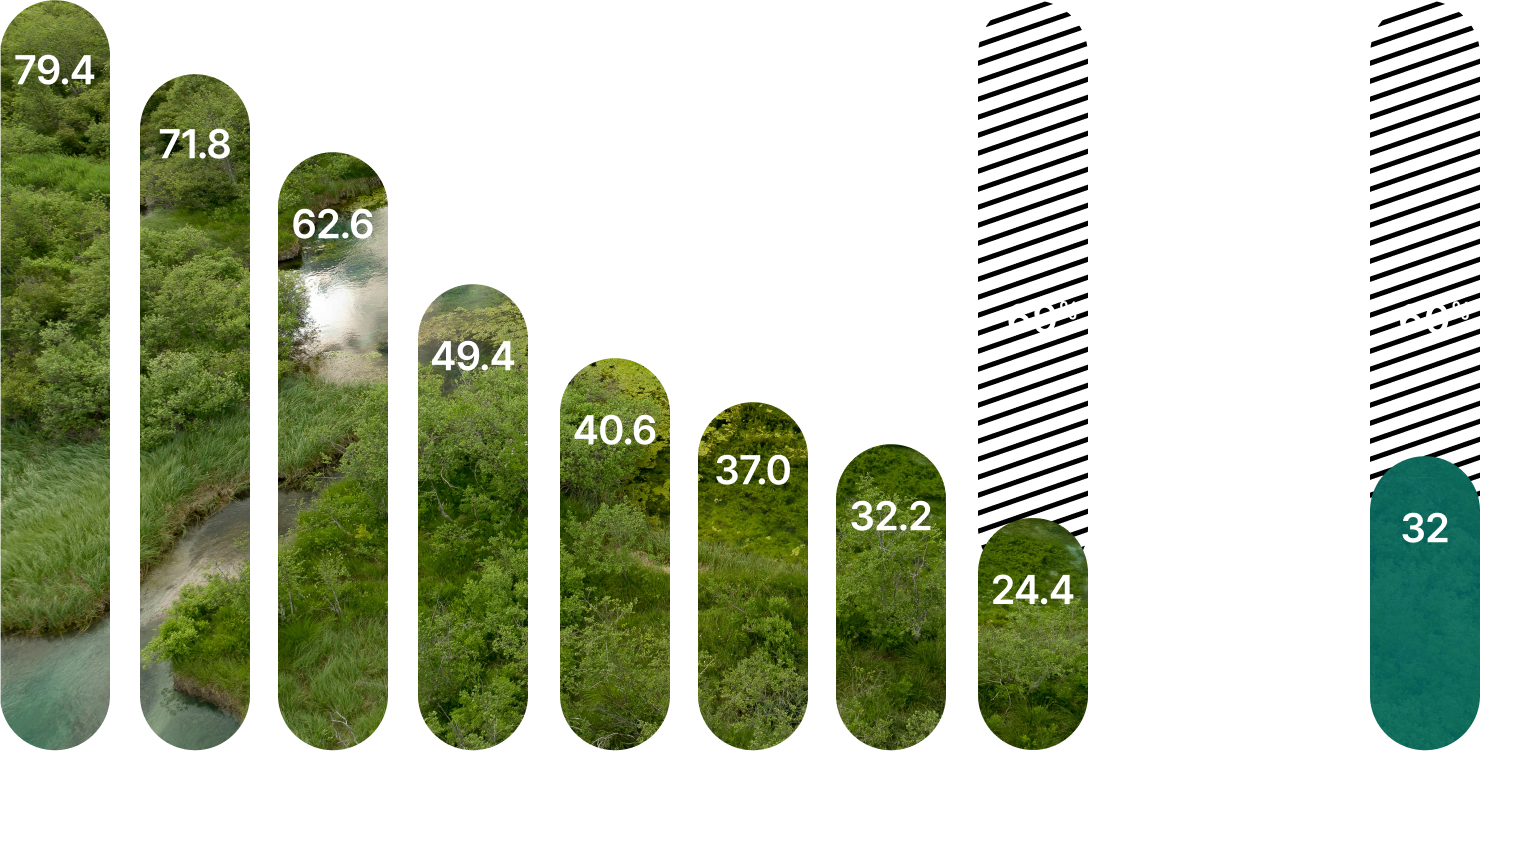
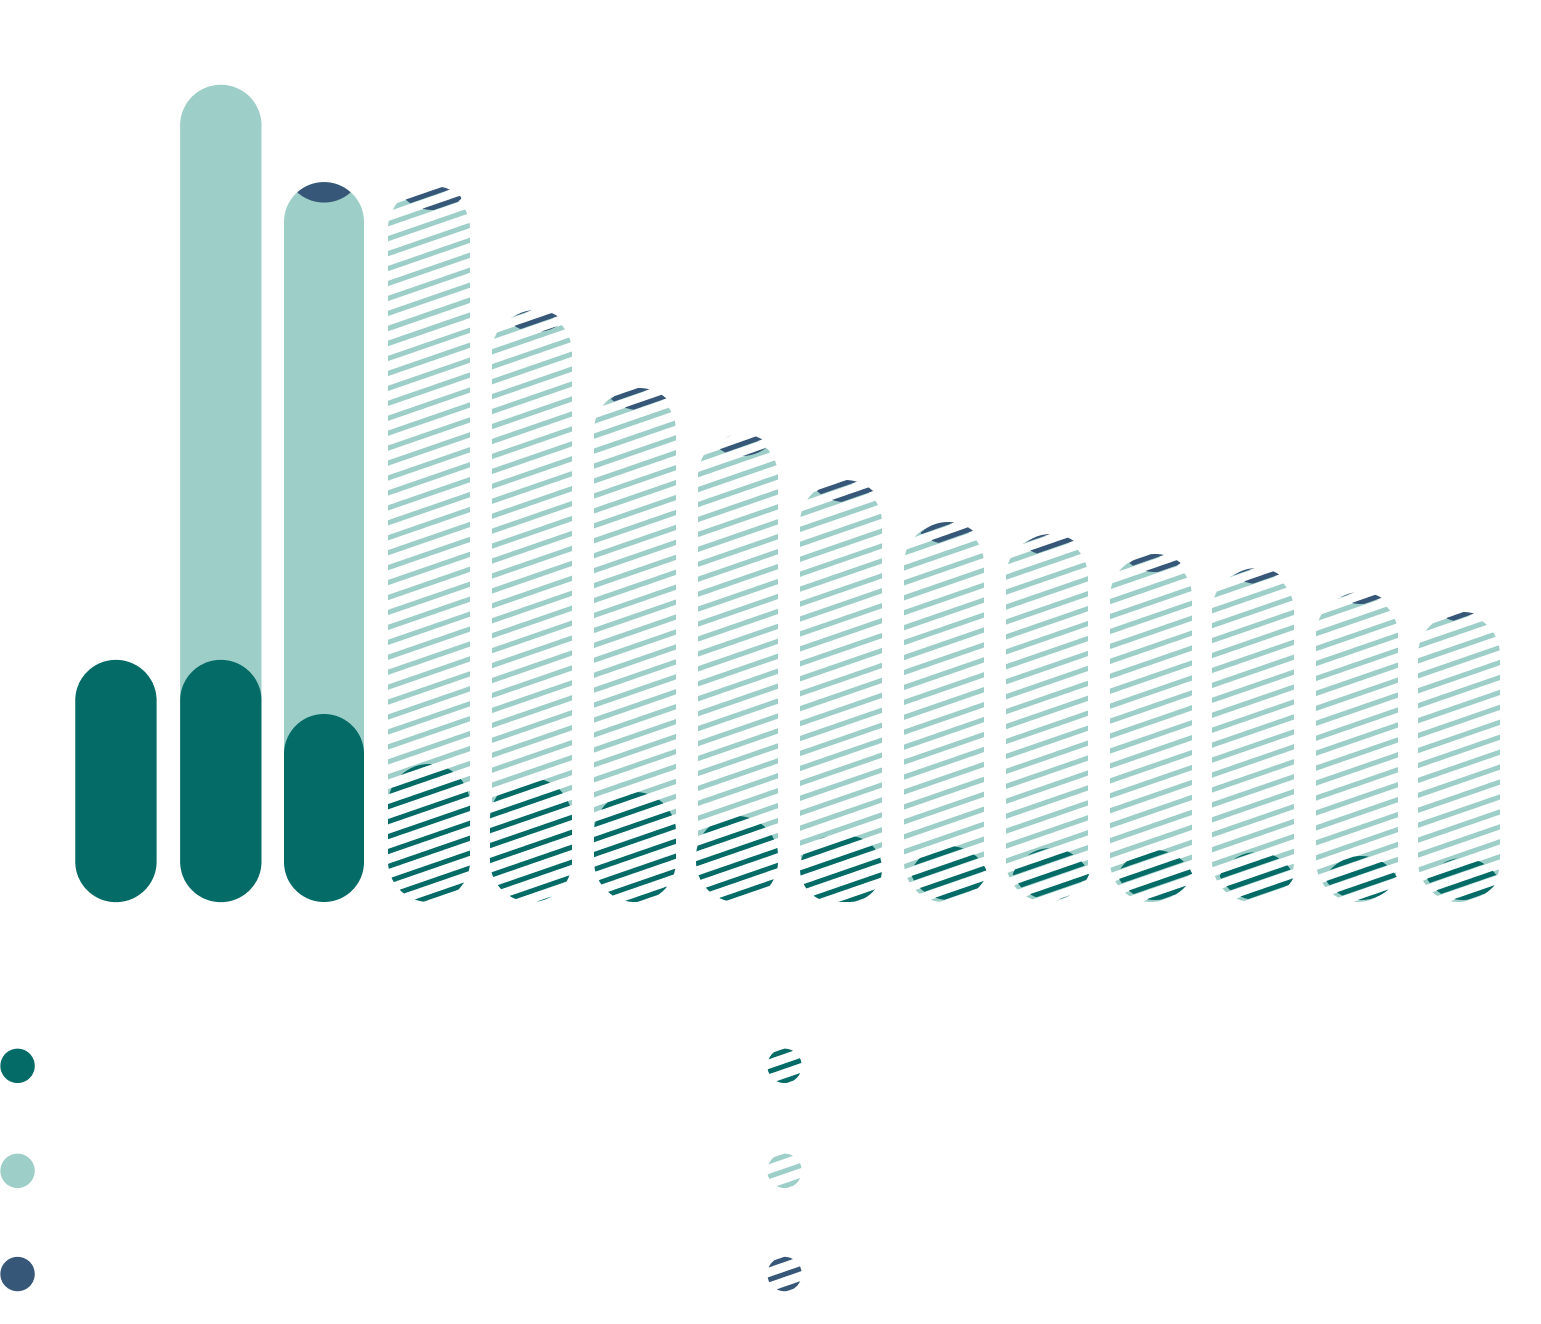
Our investment teams must adhere to a specific carbon budget for each asset class. With this approach, our carbon intensity has steadily decreased since 2017. As at December 31, 2024, it was 24.4 tCO2e/M$, compared to 79.4 tCO2e/M$ at the end of 2017.

In 2024, the carbon intensity of our portfolio was down 69% from 2017, exceeding our reduction target of 60% by 2030.

This reduction was due to the growth of our investments in low-carbon and transition assets, by the choice of assets that are lower in carbon than their comparables and by the progress made by our portfolio companies on decarbonizing.

The changes in the carbon intensity of our portfolio are not linear, and its downward trajectory could be affected by various factors over the coming years, such as asset valuations or investment opportunities in the energy transition.

Chart 4
CDPQ records a sustained decrease in its portfolio’s carbon intensity (in tCO2e/M$) since 2017
This bar chart shows the portfolio’s carbon intensity from 2017 to 2024 expressed as tCO2e/M$. It also includes the target of 60% reduction set for 2030.
 
We note that, compared to 2017, the carbon intensity:
•Is continuously decreasing
•Decreased by 69% in 2024, exceeding the target. This bar chart shows the portfolio’s carbon intensity from 2017 to 2024 expressed as tCO2e/M$. It also includes the target of 60% reduction set for 2030.
 
We note that, compared to 2017, the carbon intensity:
•Is continuously decreasing
•Decreased by 69% in 2024, exceeding the target.
Chart 5
The perimeter for calculating the carbon footprint in dollars invested and in CO2 emissions as at December 31, 2024
This stacked bar chart has two horizontal bars showing the composition of the portfolio’s carbon footprint in 2024. One bar shows information in dollars invested and the other information in terms of the carbon emissions.
 
We note that:
•Low-carbon assets and low-intensity sectors represent 79% of the portfolio’s value, and account for 28% of the total carbon footprint
•The energy, industrials, materials and non-renewable electricity sectors represent 21% of the portfolio’s value and account for 72% of the total carbon footprint. This stacked bar chart has two horizontal bars showing the composition of the portfolio’s carbon footprint in 2024. One bar shows information in dollars invested and the other information in terms of the carbon emissions.
 
We note that:
•Low-carbon assets and low-intensity sectors represent 79% of the portfolio’s value, and account for 28% of the total carbon footprint
•The energy, industrials, materials and non-renewable electricity sectors represent 21% of the portfolio’s value and account for 72% of the total carbon footprint.

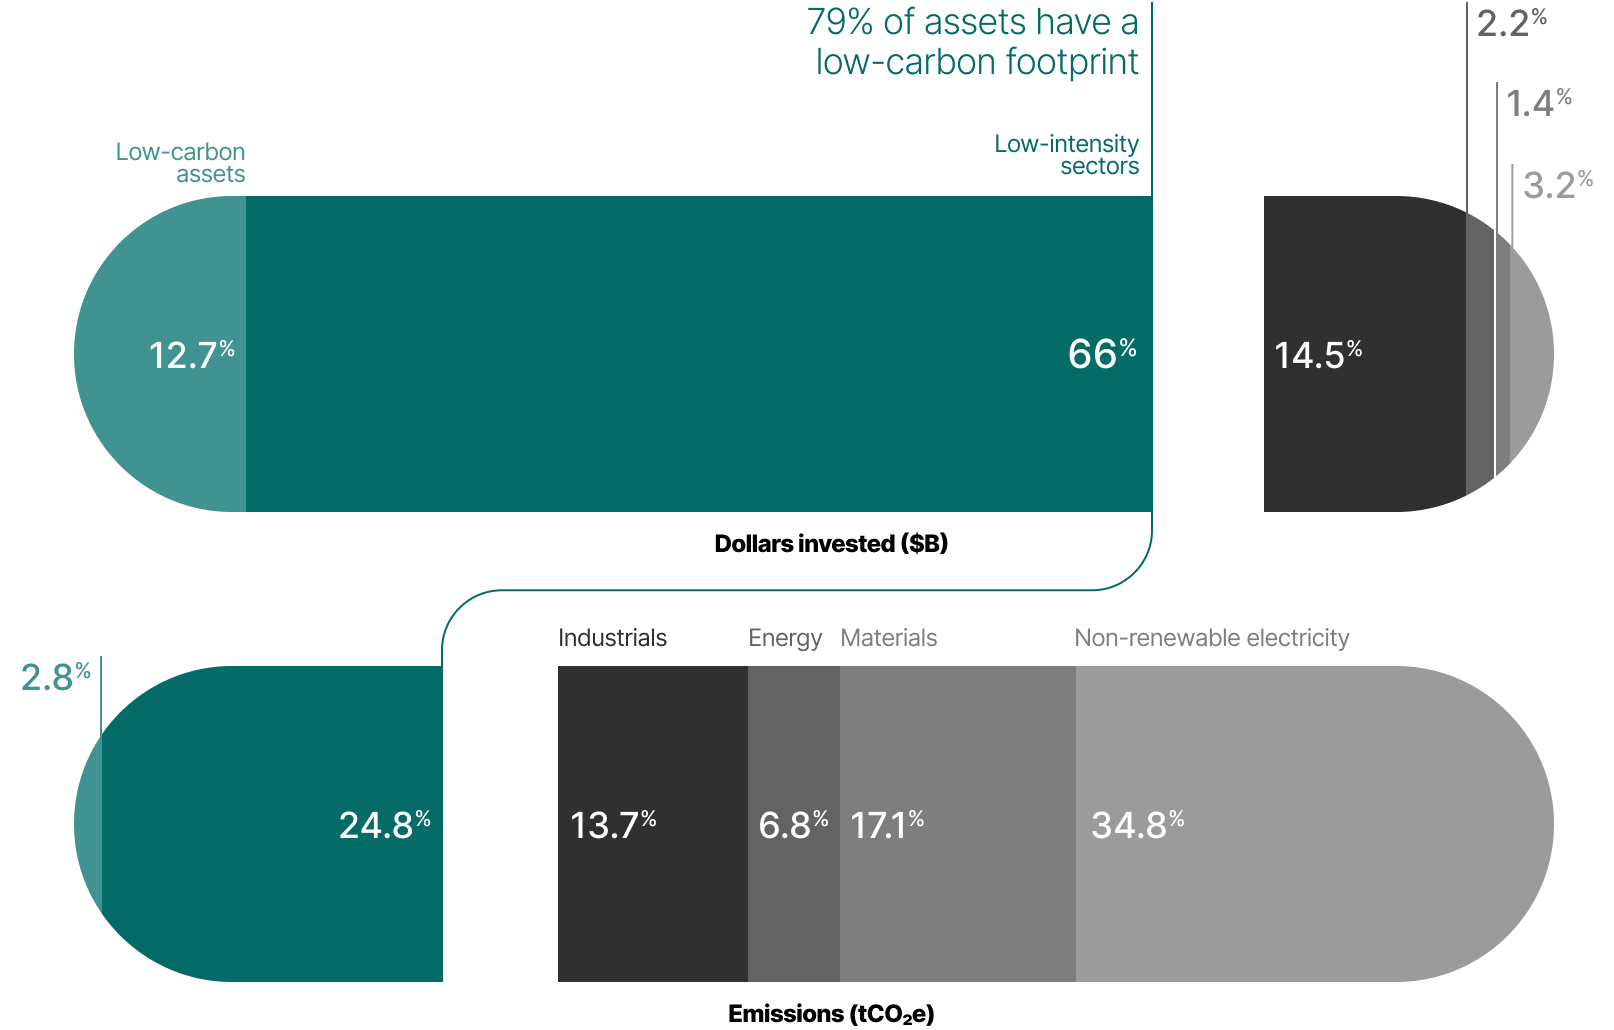
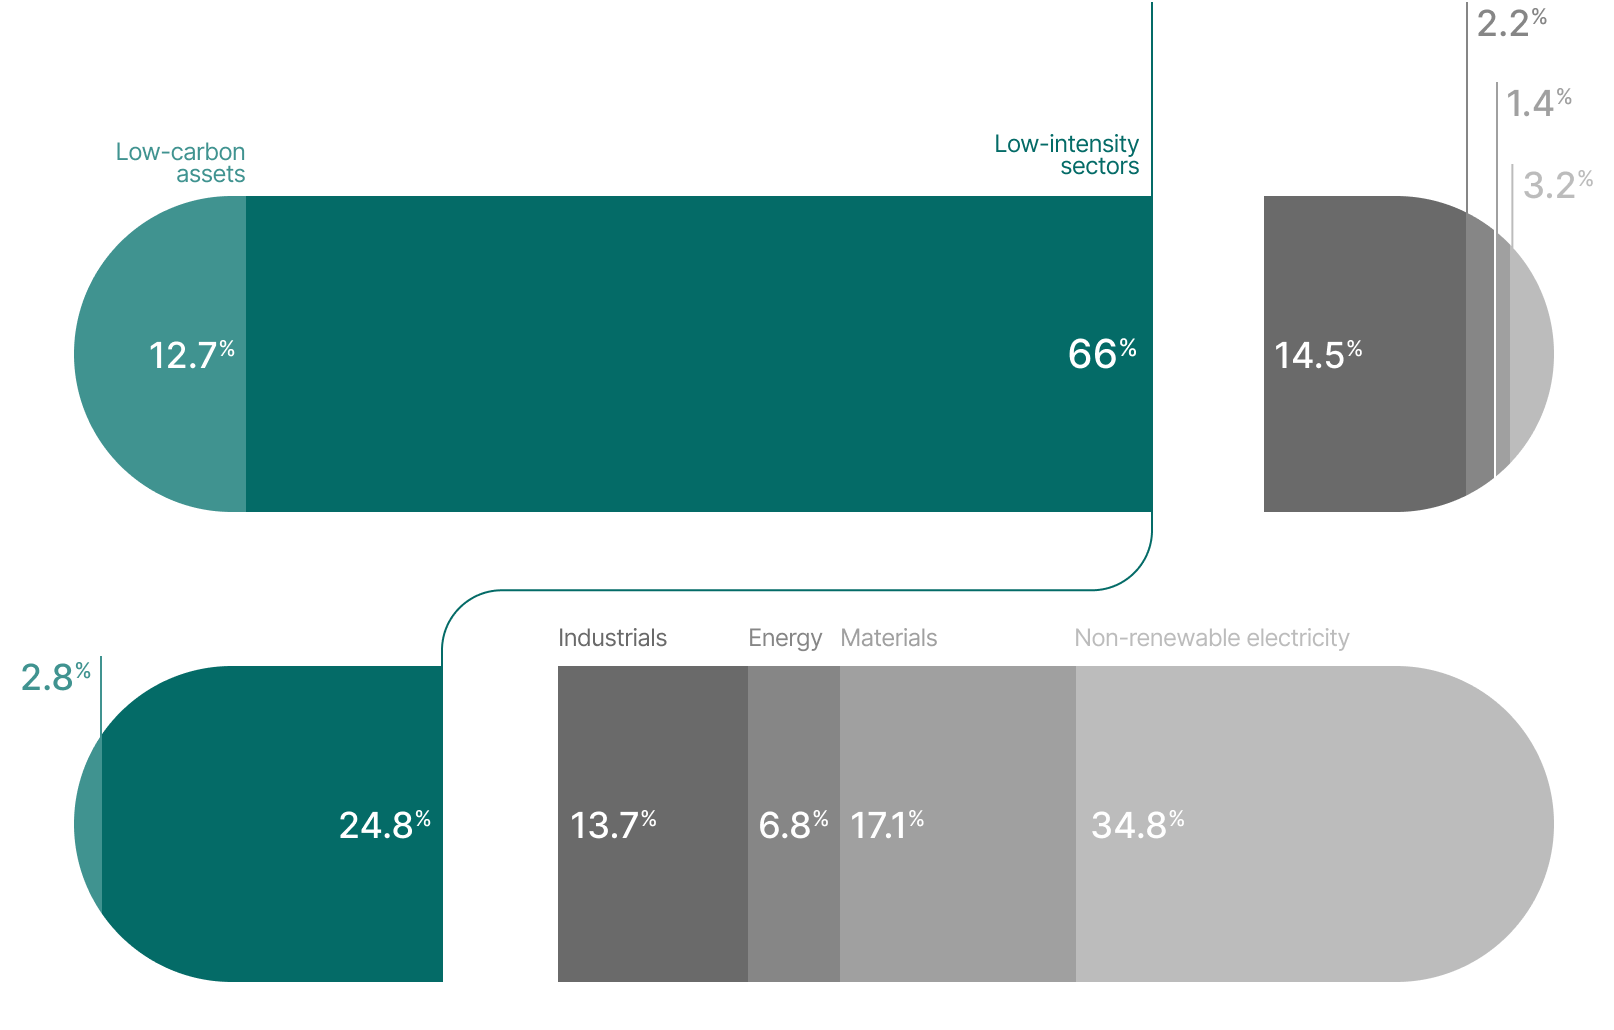
Low-carbon assets and low-intensity sectors represent 79% of the portfolio's value and 28% of its carbon footprint.

The perimeter for calculating the carbon footprint of our portfolio ($456 billion) includes assets and investments in sectors with widely varying levels of greenhouse gas (GHG) emissions.

Since 2017, our portfolio has decarbonized faster than the rest of the real economy, with our carbon footprint decreasing 48% while the portfolio grew 58% in the same period.

By the end of 2024, 79% of our portfolio consisted of low-carbon assets or investments in low-intensity sectors, representing over $358 billion.

The remainder of our portfolio includes assets from sectors necessary for the transition, such as energy production, industrials (transportation, construction) and materials (Chart 5), and represents 72% of our total footprint. As major emitters of greenhouse gases, these sectors must adopt transition plans to reduce their direct emissions and those of their value chain, thereby accelerating this reduction. To reduce this footprint, we encourage these major emitters to improve their practices.

Our assets for accelerating the transition

As part of our climate strategy, we are committed to supporting companies in heavy emitting sectors in their efforts to decarbonize. Our main focus is on the agriculture, electricity generation, transportation and materials sectors. These sectors are vital to the global economy, but we believe that they must improve their practices in order to significantly reduce their GHG emissions.

Our commitment

A $10-billion envelope to decarbonize the highest-emitting sectors

Stepping up our efforts in favour of the transition

Since 2015, we have been investing even more in the energy transition. We believe that we have an important role to play in supporting reduced GHG emissions by companies with the highest emissions. We engage with these companies, pushing them to develop ambitious plans to decarbonize their business models, and we finance the required investments. The companies in which we invest as part of this strategy must have a decarbonization plan nominally aligned with the STBi or CBI criteria.

Through our external management strategies, we partner with fund managers to invest in climate and energy transition investment funds. This approach enables us to deploy capital in clean energy and transition assets to support the decarbonization efforts of the countries involved. The decarbonization of each of these investments is regularly monitored and compared with the initial plans.

As at December 31, 2024, we held $6.2 billion in transition assets.

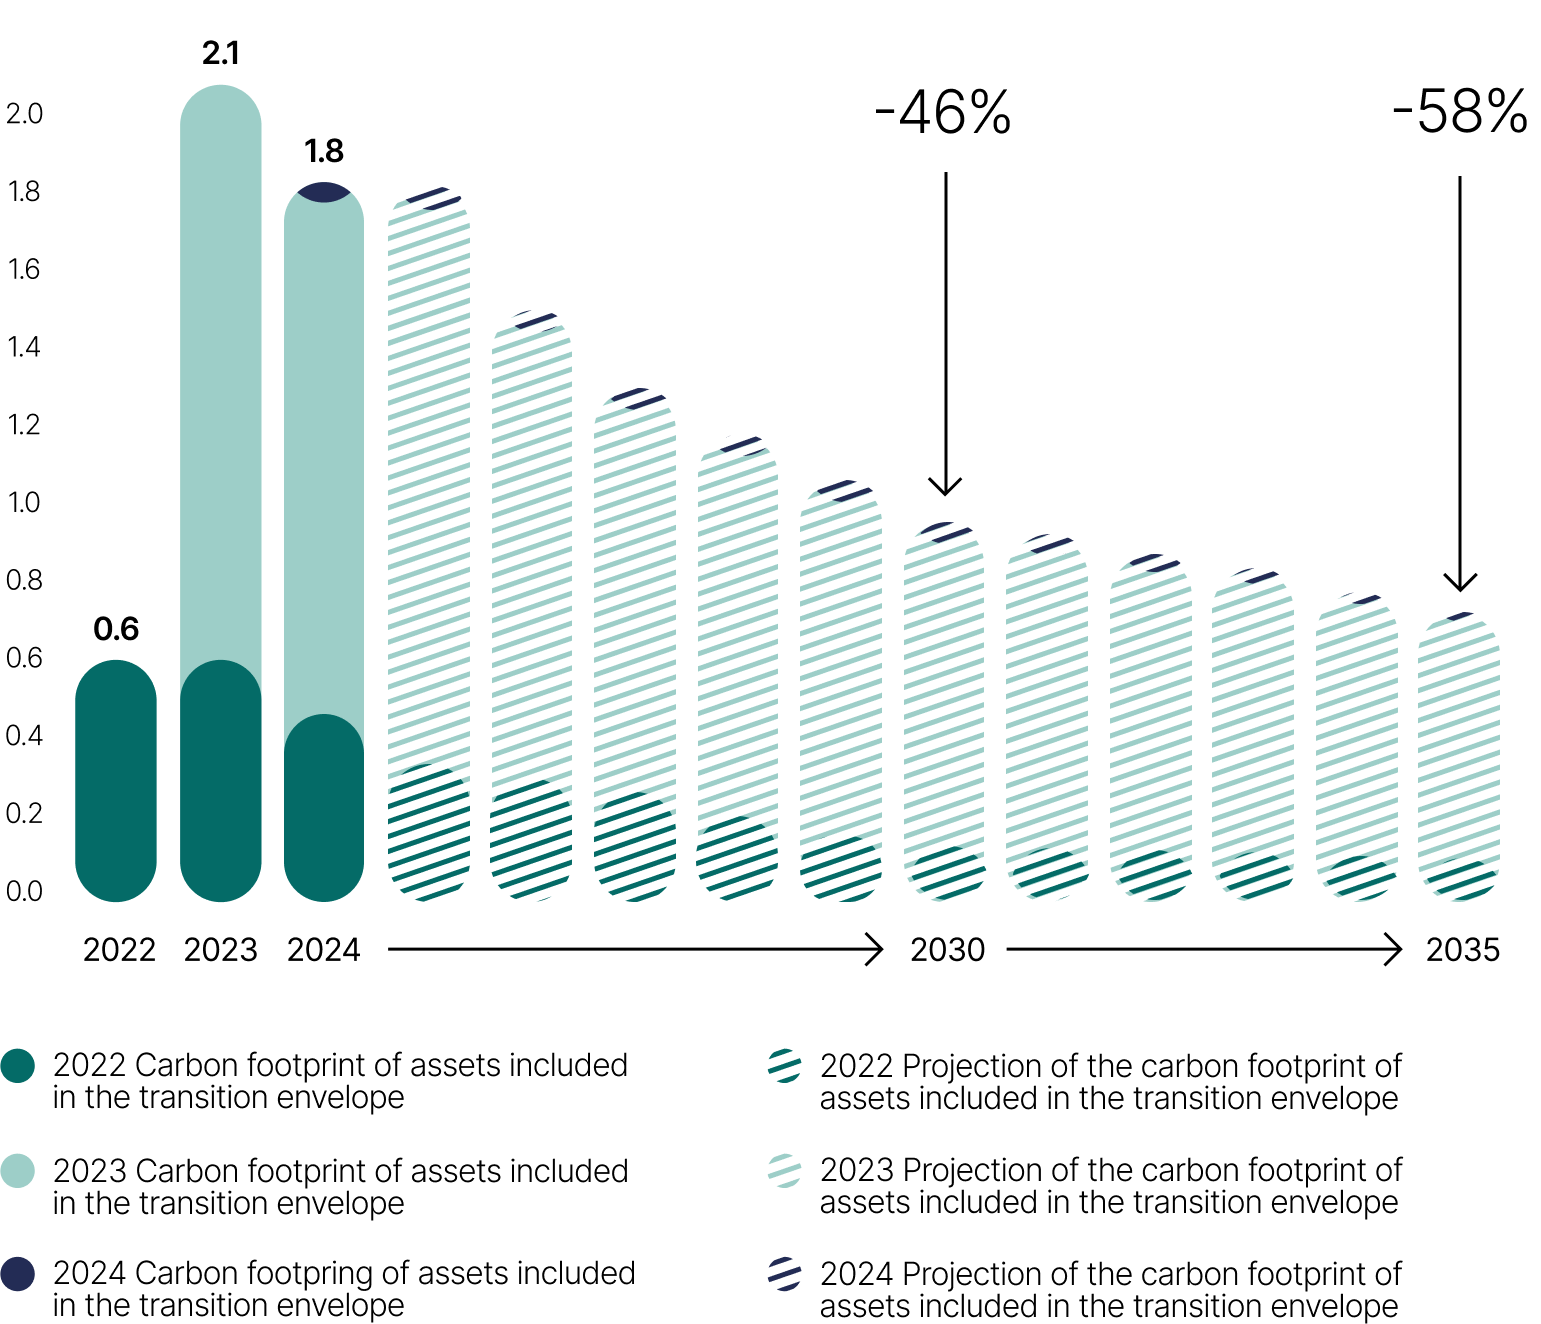
The carbon footprint of the transition envelope was 1.8 MtCO2e (Chart 6), or a carbon intensity of 917 tCO2e/M$ – see Appendix 2 for the calculation methodology.

Decarbonization plan

The decarbonization plans of the companies included in our transition envelope could reduce* its carbon footprint by 46% by 2030 and 58% by 2035, compared to 2024.

*Aggregate reduction for completed investments, calculated based on the maximum, as shown in Chart 6.

Chart 6
Projected evolution in the transition envelope’s carbon footprint (in MtCO2e)
This bar chart shows the projected change in the carbon footprint of the transition envelope from 2022 to 2035, expressed in MtCO<sub>2</sube.
 
It also shows the projected reduction in emissions of 46% by 2030 and 58% by 2035 for companies included in the transition envelope. This bar chart shows the projected change in the carbon footprint of the transition envelope from 2022 to 2035, expressed in MtCO<sub>2</sube.
 
It also shows the projected reduction in emissions of 46% by 2030 and 58% by 2035 for companies included in the transition envelope.

Our plan for the energy sector in a world in transition

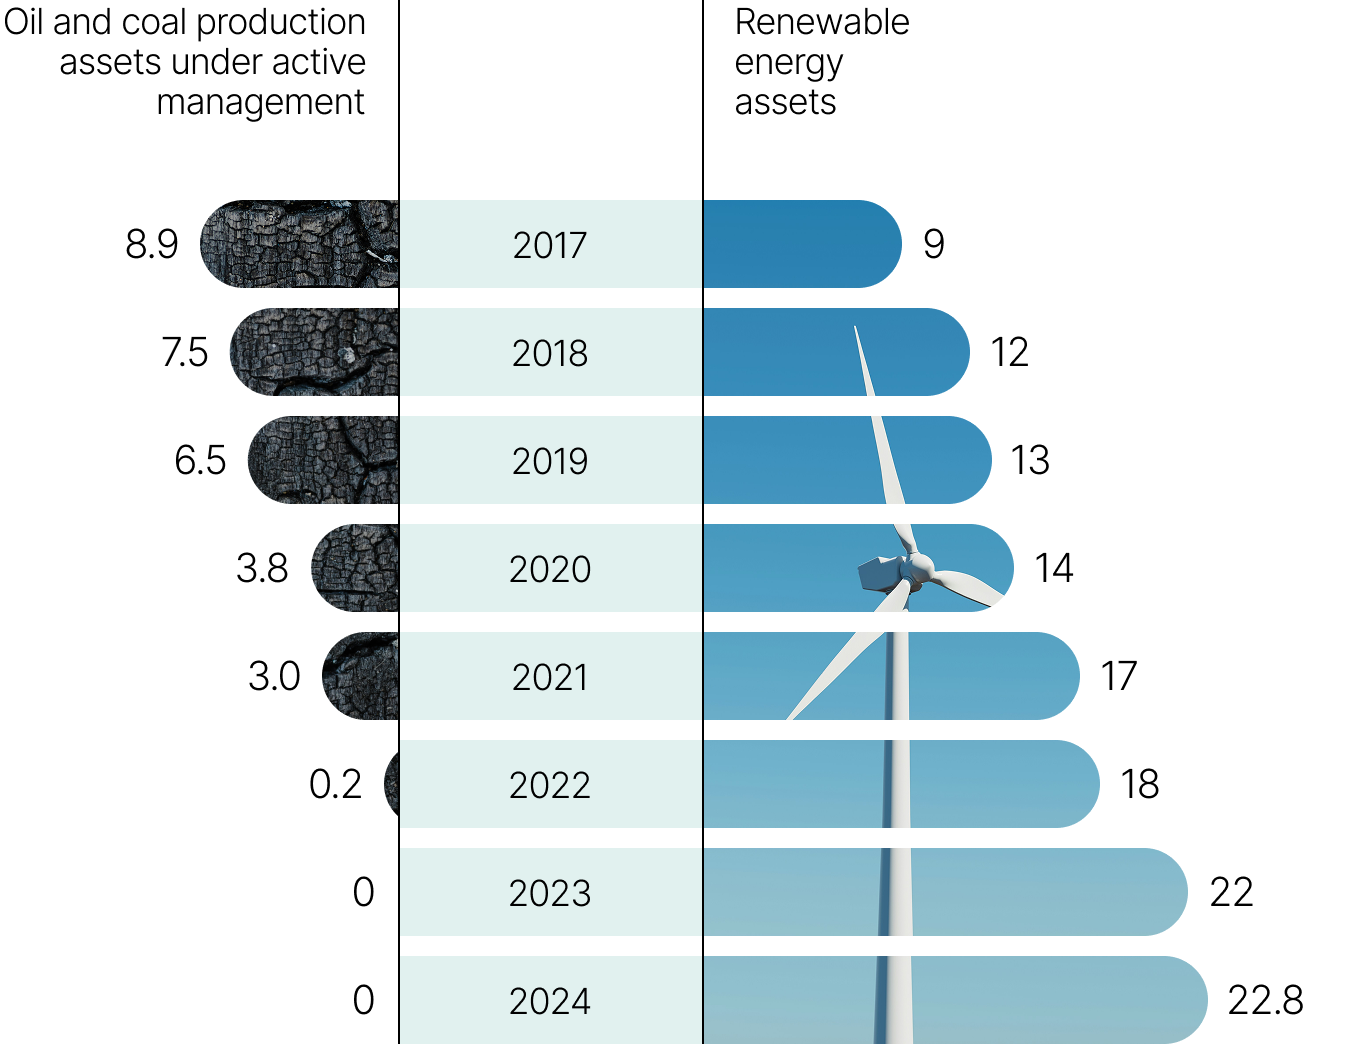
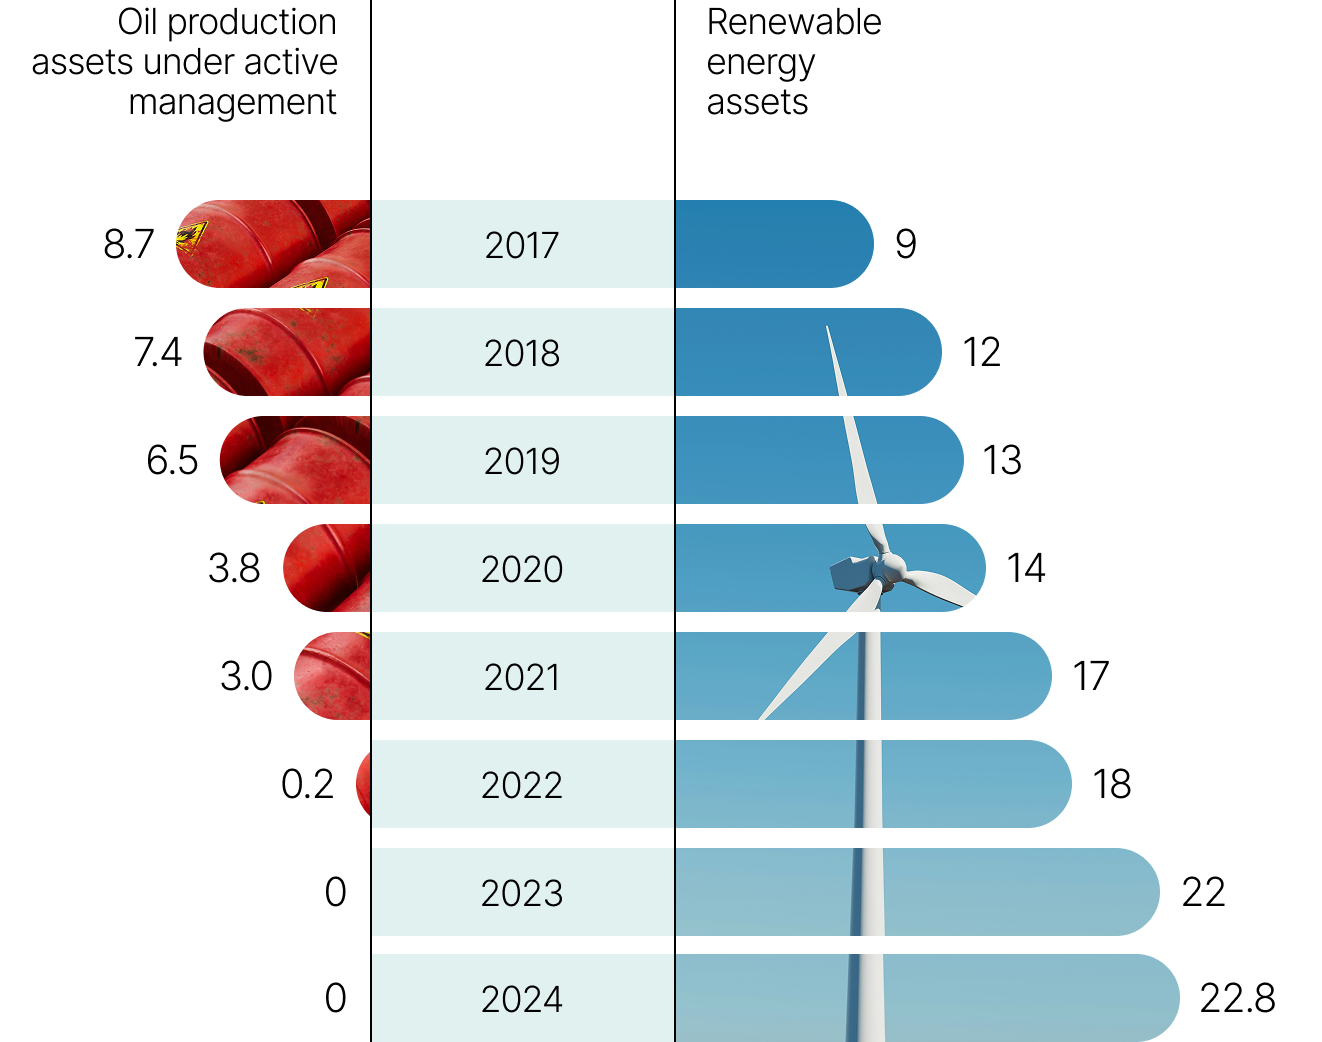
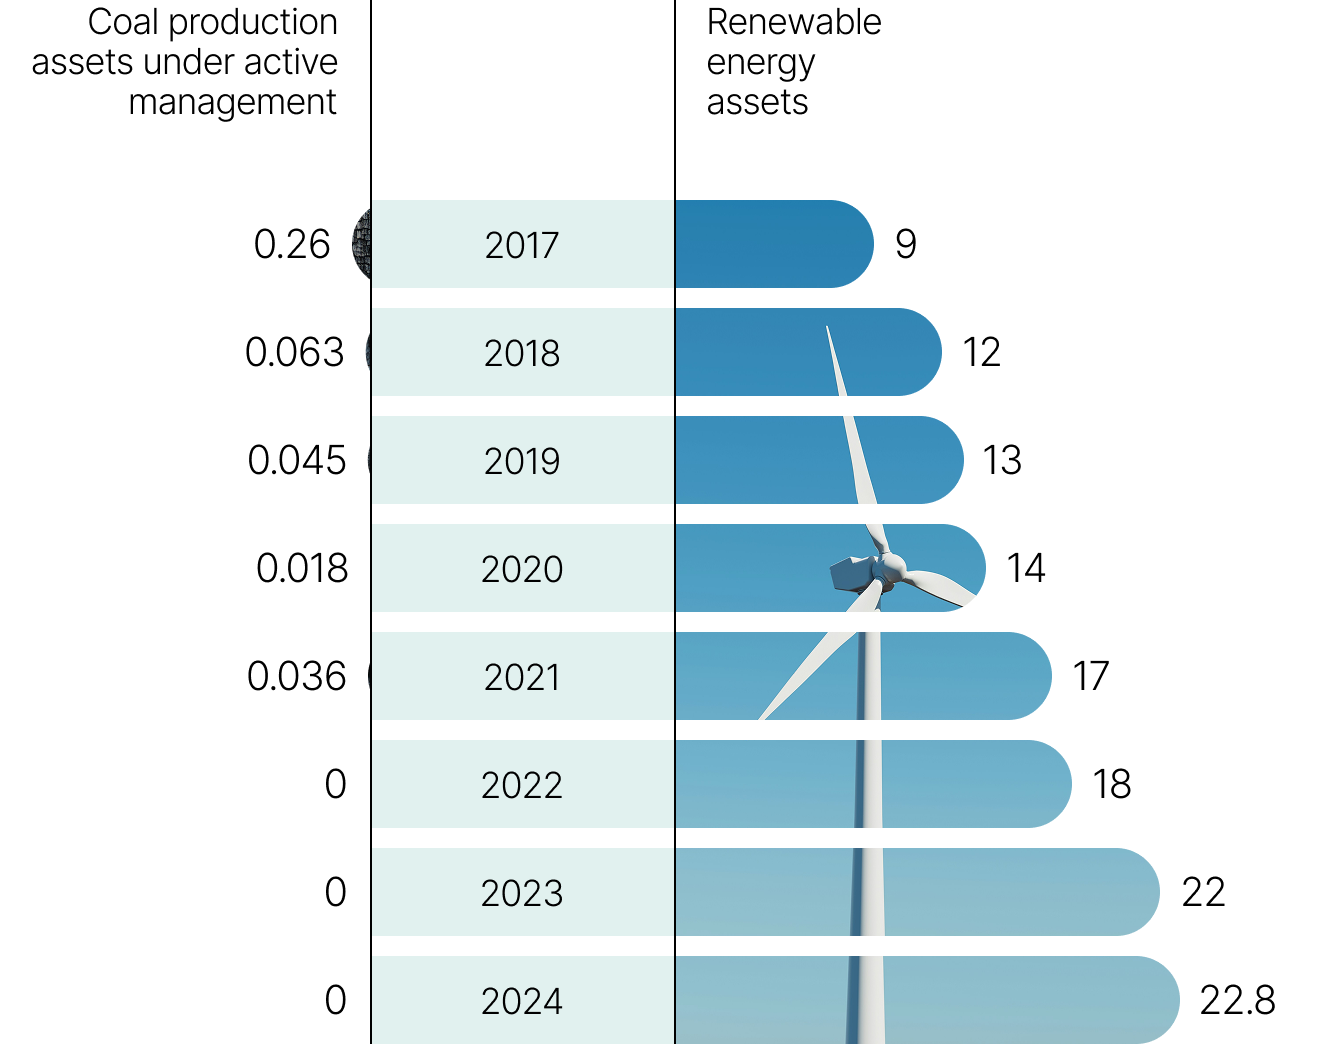
In line with our climate strategy, we had definitively withdrawn from oil production and thermal coal mining at the end of 2023, as these two sectors no longer correspond to our long-term investment objectives.

However, we see natural gas as a necessary component of the transition, complementing renewable energies. Our investments are focused on the gas transmission and distribution infrastructure, with these assets accounting for 1.6% of our portfolio.

We also favour investments in renewable energy assets, whose share of our overall portfolio is growing. By the end of 2024, renewable energy assets represented 5% of our portfolio.

Chart 7
Renewable energy assets represent a growing share of our portfolio, while oil and coal production is now excluded (in $B)
This bar chart has horizontal bars showing changes in the proportion of the portfolio’s renewable energy assets compared to actively managed oil and coal production assets between 2017 and 2024.
 
We note that:
•Renewable energy assets represent CAD 22.8 billion in 2024, compared to CAD 9 billion in 2017
•There have been no actively managed assets in the oil and coal sector since 2023, whereas they represented $8.9 billion in 2017. This bar chart has horizontal bars showing changes in the proportion of the portfolio’s renewable energy assets compared to actively managed oil and coal production assets between 2017 and 2024.
 
We note that:
•Renewable energy assets represent CAD 22.8 billion in 2024, compared to CAD 9 billion in 2017
•There have been no actively managed assets in the oil and coal sector since 2023, whereas they represented $8.9 billion in 2017.

Our biodiversity initiatives

Biodiversity is a growing concern for investors. In 2022, COP15 revealed a growing awareness in the world of finance and business of the need to preserve nature and the resulting opportunities. For several years, we have been considering biodiversity in our sustainability analyses, taking account of the serious damage inflicted on nature. In infrastructure and real estate, biodiversity is taken into account in the design of new projects and as part of their operation.

Over the years, we have joined a number of collaborative corporate engagement organizations. This approach enables us to amplify our voice effectively, send strong messages to businesses and support them in their efforts to conserve biodiversity. These initiatives also give us the opportunity to enrich our approach and develop new tools and indicators for our investment analyses.

At COP16 in 2024, in collaboration with Fondaction and the Canadian Parks and Wilderness Society (CPAWS Québec), we unveiled nine biodiversity indicators specific to Québec. These indicators are the result of a collaborative effort by the financial, research and civil society communities, and they are designed to help integrate biodiversity into investor decision-making in Québec. They provide basic information on local biodiversity and enable investors to measure the impact of a project’s implementation.
As part of this coalition, which supports investors in their commitment to combating the loss of nature, we engage with certain portfolio companies to raise awareness of the importance of biodiversity and to help them make positive changes to their business models to limit their impact on the destruction of nature.
In April 2024, we joined this United Nations Principles for Responsible Investment (UNPRI) initiative, which brings together institutional investors to leverage their influence over reversing global biodiversity loss by 2030. This collaborative engagement targets the areas of land-use change, deforestation and land degradation. Being a signatory to Spring enables us to strengthen our positioning on biodiversity through a better understanding of companies in the land, mining, chemicals and agribusiness sectors, and a concerted approach alongside other global investors.
We are a member of this international organization aimed at improving farming practices, controlling the sector’s methane production and combating the proliferation of the use of certain antibiotics that compromise the fight against microbial risks, including common diseases. In 2024, we took part in a collaborative engagement campaign with seven companies in the field of sustainable fishing. We also supported a joint statement, alongside other investors, on antimicrobial resistance linked to the overuse of antibiotics.

Sustainable Land Management

We have been investing in natural capital for several years. Our presence in this sector was strengthened in 2020 with the creation of a Sustainable Land Management team within the Infrastructure portfolio. Its mandate is to deploy up to $2 billion in agricultural and forest lands by 2026. Investments in this sector comply with rigorous sustainability criteria. They are in line with our climate strategy, targeting low-carbon assets with positive long-term benefits for the environment.

In 2024, in partnership with Chinook Forest Partners, a leader in natural capital investment management, we launched a new investment platform to deploy capital to create a diversified portfolio of forest lands in the U.S. Pacific Northwest, the world’s second-largest forest area. Chinook Forest Partners has an extensive network of landowners, forest product manufacturers, external partners and natural capital investors in the United States.

Nuveen Green Capital

In partnership with Nuveen Green Capital, an industry leader specialized in sustainable Commercial Property Assessed Clean Energy (C‑PACE) financing in the United States, we launched a $830-million (Canadian dollars) integrated financing program for the U.S. commercial market.

This program is a one-stop shop for meeting the growing demand for sustainable commercial real estate financing by combining C‑PACE financing with senior bridge loans or construction loans.

This innovative approach aims to foster a cleaner and safer built environment through energy efficiency, water conservation, renewable energy and resilience measures. The objective is to reduce the environmental impact and improve the sustainability of buildings under construction, renovations and post-construction recapitalization projects.

Aligned with the United Nations’ Sustainable Development Goals, the C‑PACE financing initiative is now available in 40 U.S. states.

Boralex

This year, Canadian leader in renewable energy production, Boralex, received validation from the SBTi of its GHG emission reduction targets covering all emissions (scopes 1, 2 and 3) in its value chain. This recognition confirms the company’s commitment to achieving a net‑zero carbon footprint by 2050, in line with the objectives of the Paris Agreement.

Boralex is committed to a 42% reduction in its absolute scopes 1 and 2 emissions by 2030, compared to the 2022 benchmark year. In addition, by 2028, the company is committed to achieving science-based reduction targets for 90% of the emissions originating from its major component suppliers.

By 2050, Boralex is committed to a 90% reduction in its absolute scopes 1 and 2 emissions, and a 97% reduction in its scope 3 emissions per kWh produced and sold compared to the 2022 benchmark year.

To achieve its objectives, Boralex focuses on progressively electrifying its vehicle fleet, consuming renewable electricity at its sites and buildings, and partnering with strategic low-carbon suppliers.

As a major shareholder since 2017, CDPQ is in continuous dialogue with the company on sustainability issues, including the climate transition, physical climate risks and disclosure. The SBTi’s validation of the company’s GHG emission reduction targets corresponds to the highest level of CDPQ’s framework on the climate transition and represents the most ambitious target recognized by the SBTi.

Photos: Boralex
See next section – Social